Download presentation
Presentation is loading. Please wait.

1
SCATTEROMETER

2
What is a Scatterometer?
A scatterometer is a microwave radar sensor used to measure the reflection or scattering effect produced while scanning the surface of the earth from an aircraft or a satellite.

3
Backscatter modulation by surface roughness
® Z.Jelenak

4
Backscatter modulation by surface roughness
® Z.Jelenak 4

5
Backscatter modulation by surface roughness
® Z.Jelenak 5

6
Backscatter modulation by surface roughness
® Z.Jelenak 6

7
Backscatter as a Function of Wind Speed and Incidence Angle
Most sensitivity to wind at moderate incidence angles 30°-60° ® Z.Jelenak

8
Backscatter as a Function of Wind Speed and Incidence Angle
Most sensitivity to wind at moderate incidence angles 30°-60° ® Z.Jelenak 8

9
Backscatter as a Function of Wind Speed and Incidence Angle
Most sensitivity to wind at moderate incidence angles 30°-60° ® Z.Jelenak 9

10
Backscatter as a Function of Wind Speed and Incidence Angle
Most sensitivity to wind at moderate incidence angles 30°-60° ® Z.Jelenak 10

11
Backscatter Sensitivity to Wind Direction
5m/s ® Z.Jelenak

12
Backscatter Sensitivity to Wind Direction
20m/s 15m/s 10m/s 5m/s ® Z.Jelenak 12

13
Backscatter Sensitivity to Wind Direction
30m/s 25m/s 20m/s 15m/s 10m/s 5m/s ® Z.Jelenak 13

14
Back Scattering Theory
Bragg scattering Incoming microwave radiation in resonance with short waves (dominant for 30°< q < 70 °) lB = l/(2sin(q) Specular reflection Ocean facets normal to incident radiation (non-negligible for q < 30°) Accuracy of theoretical models ~1 dB and not adequate Caps of waves tend to align perpendicular to local wind direction Sharp shape of leeward side of the capillary wave results more ocean radar return upwind than in the downwind direction l ~ 2cm (Ku-band) ; l ~ 5cm (C-band)
 lB = l/(2sin(q) Specular reflection. Ocean facets normal to incident radiation (non-negligible for q < 30°) Accuracy of theoretical models ~1 dB and not adequate. Caps of waves tend to align perpendicular to local wind direction. Sharp shape of leeward side of the capillary wave results more ocean radar return upwind than in the downwind direction. l ~ 2cm (Ku-band) ; l ~ 5cm (C-band)")
15
Bragg’s Resonance

16
Sea Surface Roughness - Oblique-viewing microwave radiometers
Tropical cyclone observed by QuikSCAT in June 2007.

17
SEASAT-A SCATTEROMETER ANTENNA PATTERN
SASS uses four fan beam antennas — two on either sides of the sub-satellite track The two antennas on each side are aligned so that they are pointed 45° and 135° relative to the spacecraft flight direction

18
NSCAT ANTENNA PATTERN Two sets of antennae covering both sides of the track Each set has three antennae covering a swath of 800Km Polarisation of MW radiation emitted and received by the mid beam is both vertical (VV) and horizontal(HH) For others only VV polarisation is used
 and horizontal(HH) For others only VV polarisation is used.")
19
PENCIL BEAM ANTENNA PATTERN
Consists of two off nadir beams inner and outer Each point in the inner swath is scanned twice by the inner and twice by outer beam These four enable retrieval with better accuracy

20
ADVANTAGES OF PENCIL BEAM SCATTEROMETER
High o measurement accuracy due concentrated pencil beam High directional accuracy as each point is viewed four times No nadir gaps Simplified Model Functions: Only two incident angle Easier signal processing Smaller in size

21
Where to Get Scatterometer Data
NRL Monterey NOAA/NESDIS QuikSCAT Storms page – includes ambiguities: Alternative NOAA site, with SSMI wind speeds: FNMOC Remote Sensing Systems Scatterometer winds from NRL page and QuikSCAT are the same though display is different. They are overlayed on sat pic on the NRL page which is useful. Note that RSS is not operational – delay in processing means that it is really only useful as a post analysis tool. APSATS 2002, Melbourne Australia

22
APSATS 2002, Melbourne Australia
Differences Wind retrieval RSS uses KU-2000 wind retrieval method Others use QuikSCAT1 wind retrieval method Rain Flags Generally Multidimensional Histogram (MUDH) procedure – a statistical method based on “noisiness” of data RSS has similar approach though it is less conservative and hence rain affected areas are often smaller Rain flags – NRL – circles at end of wind barb QuikSCAT – black wind barbs FNMOC – Green circles at ends of barbs – the brown dots indicate “edge vectors” RSS – Brown dots at end of barbs APSATS 2002, Melbourne Australia
 procedure – a statistical method based on noisiness of data. RSS has similar approach though it is less conservative and hence rain affected areas are often smaller. Rain flags – NRL – circles at end of wind barb. QuikSCAT – black wind barbs. FNMOC – Green circles at ends of barbs – the brown dots indicate edge vectors RSS – Brown dots at end of barbs. APSATS 2002, Melbourne Australia.")
23
APSATS 2002, Melbourne Australia
Ambiguity Selection NOAA/NESDIS use rain flagged data in ambiguity selection process FNMOC does not – rain flagged data is put in “as is” after ambiguity removal. Therefore generally bigger discontinuity in data for FNMOC around rain flagged areas. APSATS 2002, Melbourne Australia

24
APSATS 2002, Melbourne Australia
What is it GOOD for? Detection of circulations and determination of windspeeds. X FNMOC NRT plot. 09/04/ Z TC Bonnie in its early stages. Note gales on the southern side. APSATS 2002, Melbourne Australia

25
APSATS 2002, Melbourne Australia
Small system (X) could be followed for 3 days --no help from NWP model 20S 170W 170W O O X X X O 25 Jan 1800Z Jan 0517Z Jan 1800Z 170W Slide from Roger Edson. 160W 170W 160W O X O APSATS 2002, Melbourne Australia 27 Jan 1712Z Jan 0427Z
 could be followed for 3 days --no help from NWP model. 20S. 170W. 170W. O. O. X. X. X. O. 25 Jan 1800Z 26 Jan 0517Z 26 Jan 1800Z. 170W. Slide from Roger Edson. 160W. 170W. 160W. O. X. O. APSATS 2002, Melbourne Australia. 27 Jan 1712Z 28 Jan 0427Z.")
26
APSATS 2002, Melbourne Australia
What is it GOOD for? Location of fronts/troughs. Wind speeds in data sparse areas. Useful for high seas forecasts over the Southern and Indian Oceans where observations are few and far between. Can be useful in determining the surface location of fronts when IR imagery disguises it. APSATS 2002, Melbourne Australia

27
APSATS 2002, Melbourne Australia
When is it BAD? Edge of swath (~ 7 wind vector cells) Rain effects Sensitivity to errors in NWP Practical wind regime 5-45 m/s (problems with both very light and very strong winds) Resolution (25km) – impact in tight gradients Ambiguity Removal Process and rain flag process can affect final solution Although there are many problem areas, there is useful information to be gained from most passes. On any individual pass, the problem areas must be identified and worked around. APSATS 2002, Melbourne Australia
 Rain effects. Sensitivity to errors in NWP. Practical wind regime 5-45 m/s (problems with both very light and very strong winds) Resolution (25km) – impact in tight gradients. Ambiguity Removal Process and rain flag process can affect final solution. Although there are many problem areas, there is useful information to be gained from most passes. On any individual pass, the problem areas must be identified and worked around. APSATS 2002, Melbourne Australia.")
28
APSATS 2002, Melbourne Australia
Edge Problems Along the whole edge… or small portion… In the FNMOC display, the edge wind vectors are identified with a brown dot at the stem of each wind vector plot. In the examples, above, the left case shows a large area almost along the entire swath where the winds seem to be incongruous with the rest of the swath (both in excess speed and for winds pointing parallel to the swath direction). In the blow up section on the right, the edge data is indicated by the brown dots (except where a rain flag is indicated—where both effects are occurring). In this example only a small portion appears to not fit the pattern. (Note, even in the edge region, both light winds and rain-affected winds can be well represented). Remember, the data are not always bad. If it looks good, use it!. (from Edson) FNMOC DISPLAY APSATS 2002, Melbourne Australia
. In the blow up section on the right, the edge data is indicated by the brown dots (except where a rain flag is indicated—where both effects are occurring). In this example only a small portion appears to not fit the pattern. (Note, even in the edge region, both light winds and rain-affected winds can be well represented). Remember, the data are not always bad. If it looks good, use it!. (from Edson) FNMOC DISPLAY. APSATS 2002, Melbourne Australia.")
29
APSATS 2002, Melbourne Australia
Rain Flags RSS TC Chris 05/02/ Z All the operational scat pages have the same rain flag determination. RSS is the only one that differs. Which one is correct? Answer probably somewhere in between. Rain flagged areas APSATS 2002, Melbourne Australia NRL

30
APSATS 2002, Melbourne Australia
Typical Rain Patterns Rain effects: Cross swath vectors Higher wind speeds Some intense rain not flagged APSATS 2002, Melbourne Australia RSS slide

31
APSATS 2002, Melbourne Australia
Rain Effects One or two bad wind solutions may affect neighboring wind vector cells through buddy-checking system causing a ‘rain contagion’ effect. TC Chris 05/02/ Z Direction of swath Uni-directional winds across obvious eye on sat pic. Rain block – direction perpendicular to swath Do not use direction – speed may be OK APSATS 2002, Melbourne Australia

32
APSATS 2002, Melbourne Australia
Streamlines TC Chris 03/02/ Z Beware of winds perpendicular to the swath, even when they are not flagged X Use the good winds outside the rain blocks. Look for non-rain flagged winds APSATS 2002, Melbourne Australia

33
APSATS 2002, Melbourne Australia
Model initialisation errors In this case, poor model initialization combined with a lower skill nadir position, picks proper wind speed, but NO circulation center 20/2356Z AVN 19/12Z tau 24 (Light winds?) -----low skill c 10S c 10S ? Max Wind 55 KTS ? 20S TC Paul 20S APSATS 2002, Melbourne Australia
 -----low skill. c. 10S. c. 10S. Max Wind 55 KTS. 20S. TC Paul. 20S. APSATS 2002, Melbourne Australia.")
35
ASCAT WINDS

36
ASCAT WINDS OVER INDIA :13 AUG 12

37
ASCAT WINDS OVER INDIA :13 AUG 12

38
OCEANSAT 2 WINDS:13 AUG 12

39
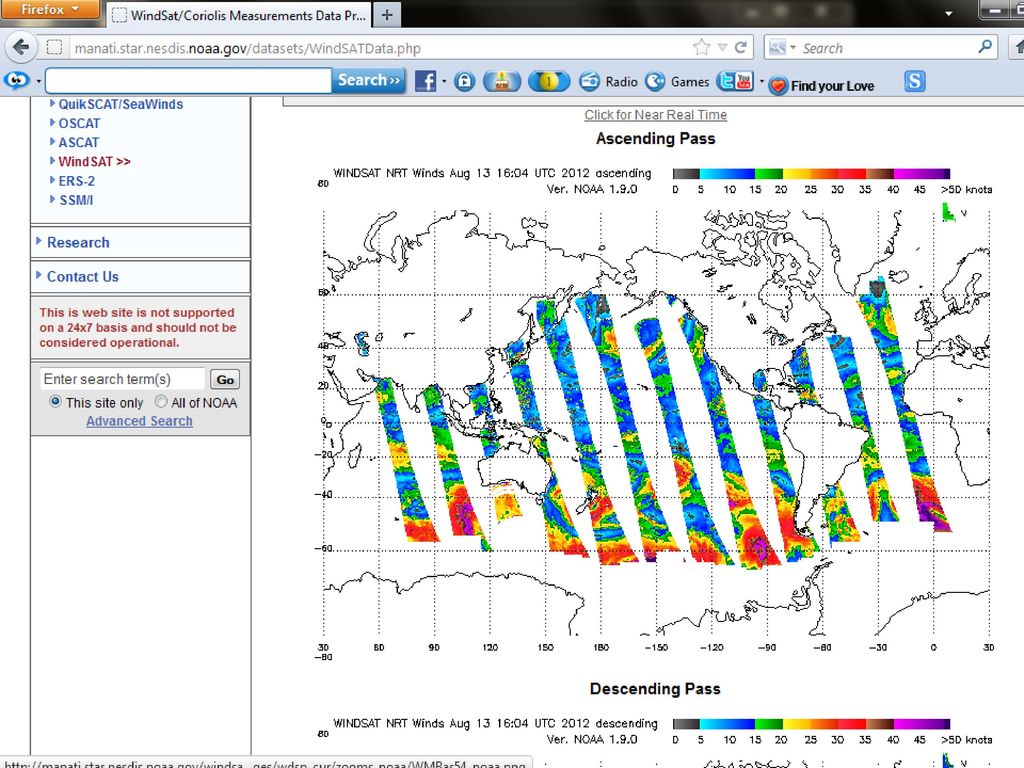
WINDSAT is a joint NOAA Integrated Program Office
/Department of Defense/NASA demonstration project, intended to measure ocean surface wind speed and wind direction from space using a polarimetric radiometer. It was launched aboard the Coriolis satellite by a Titan II rocket on 6 January 2003 into a 830-km 98.7-degree orbit, and is designed for a three-year lifetime.

42
WINDSAT WindSat is a satellite-based polarimetric microwave radiometer developed by the Naval Research Laboratory Remote Sensing Division, the Naval Center for Space Technology, and the National Polar-orbiting Operational Environmental Satellite System (NPOESS) Integrated Program Office (IPO). It was launched in January 2003 aboard the joint DoD/Navy platform Coriolis, with a planned 3-year life. Despite its extended lifespan, it continues to function quite well. WindSat measures the ocean surface wind vector, as well as cloud liquid water, sea surface temperature, total precipitable water, and rain rate (over water only). Derived products include soil moisture and sea ice.
 Integrated Program Office (IPO). It was launched in January 2003 aboard the joint DoD/Navy platform Coriolis, with a planned 3-year life. Despite its extended lifespan, it continues to function quite well. WindSat measures the ocean surface wind vector, as well as cloud liquid water, sea surface temperature, total precipitable water, and rain rate (over water only). Derived products include soil moisture and sea ice.")
43
The Navy, NOAA, and UK Met Office frequently use WindSat data in several operational forecast models. Coriolis is sun-synchronous (1800 UTC equator crossing time) and WindSat has a swath width of ~1000 km, with a resolution is ~50 km. WindSat data had always been a secondary wind observation with QuikSCAT (launched 1999) as the primary source, because of its better resolution and accuracy. However, when QuikSCAT failed in 2009, NRL researchers were encouraged to push their improved WindSat algorithm into operations.
 and WindSat has a swath width of ~1000 km, with a resolution is ~50 km. WindSat data had always been a secondary wind observation with QuikSCAT (launched 1999) as the primary source, because of its better resolution and accuracy. However, when QuikSCAT failed in 2009, NRL researchers were encouraged to push their improved WindSat algorithm into operations.")
44
APSATS 2002, Melbourne Australia
Conclusions Provides coverage over data sparse areas Wind speeds generally good – useful for areas of gales etc Use the data if it makes sense Be aware of low skill areas and different ambiguity removal processes (compare!) Do not use in isolation APSATS 2002, Melbourne Australia
 Do not use in isolation. APSATS 2002, Melbourne Australia.")
Similar presentations


- Active Spaceborne Remote Sensing and Operations Bryan.>")


